Repository containing the code for previous football analytics visualizations and articles. This repository will occasionally be updated with small analytics projects, typically for articles written for Fear the Wall. Every now and then I will work on more in-depth football analytics projects, which will be contained in their own repositories, and linked to from here.
As some of this has been done retroactively, the repository isn’t exhaustive, and some of the code could be done with being cleaned up (something I’ll pretend that I will get to one day, but that will probably never happen). Nonetheless, many of the examples should be reproducible, and more recent examples should be cleaner, better organised, and better documented.
The archive folder contains pieces of work that are older and some of which has missing data or code. It’s the rug I’m sweeping the worst of my code under, from before I was better at tracking what I’m doing…
Developed an advanced machine learning model to enhance early diagnosis and intervention for Autism Spectrum Disorder (ASD) by analyzing video recordings from clinical sessions. Utilized SQL for data preprocessing, Python and PyTorch for model implementation, and tools like FFmpeg, labelimg, Roboflow, Detectron2, and Video Swin Transformer for data extraction, annotation, and training. The project efficiently identified ASD-related behaviors with an accuracy of 86.3%, improved data preprocessing and labeling efficiency by 40%, and reduced manual annotation time by 50%. This project significantly aids clinicians by automating behavior detection, providing a reliable tool for accurate and timely ASD diagnosis.
Implemented a comprehensive data-driven strategy for analyzing patient demographics, medical conditions, and treatment details in a healthcare dataset using SQL. This approach led to enhanced insights into patient behavior and treatment outcomes by identifying key metrics such as patient age distribution, gender demographics, insurance utilization, and medication usage patterns. The proposed analysis methodology offers a fully automated and flexible framework for healthcare providers and insurance companies to optimize resource allocation, improve patient care strategies, and enhance overall operational efficiency.
Executed a robust analysis of over a million real estate sales records using SQL for data preprocessing, and Excel, Google Sheets, and Tableau for analysis and visualization. This approach identified key performance indicators such as total sales, total profits, and the number of properties sold, revealing significant correlations and trends. Rigorous data cleaning and validation ensured data integrity, making this project a reliable tool for market analysis. The resulting comprehensive dashboard provides stakeholders with valuable insights for strategic decision-making in real estate investments.
Conducted an in-depth analysis of a dataset featuring 10,000 movies from The Movie Database (TMDb), encompassing user ratings, revenue figures, and detailed insights such as cast members and genres. With columns like ‘cast’ and ‘genres’ containing multiple values, the data’s complexity was highlighted. The objective was to explore this multifaceted dataset to uncover meaningful insights into the film industry’s dynamics. The analysis aimed to reveal relationships between factors like user ratings, revenue streams, genres, and cast compositions, providing a comprehensive understanding of these intricate interactions.
Executed an A/B test for an e-commerce company to evaluate a new webpage design aimed at increasing user conversions. Analyzed user interactions and conversion metrics for a control group with the original webpage and a treatment group with the redesigned version. Leveraged statistical techniques and rigorous data analysis to determine if the redesigned webpage resulted in a statistically significant increase in conversions compared to the control group.
This project focused on wrangling and analyzing data from the WeRateDogs Twitter account using Python and its libraries, documented in a Jupyter Notebook (Twitter_dogsrate.ipynb). The WeRateDogs account humorously rates dogs, often using numerators greater than 10 against a denominator of 10. The goal was to create insightful and trustworthy analyses and visualizations. The provided Twitter archive contained basic tweet data for over 5000 tweets, which was supplemented with additional data gathered using Twitter’s API.
Launching into a comprehensive analysis, this project delves into Prosper’s dataset, spanning 113,937 loan listings from Q4-2005 to Q1-2014. With 81 variables covering borrower profiles, loan performance, and listing specifics, our approach employs meticulous Exploratory Data Analysis (EDA) to uncover patterns and anomalies. By integrating robust data validation, our goal is to derive actionable insights empowering stakeholders to refine loan underwriting, fortify risk management, and optimize portfolio performance in peer-to-peer lending
In this project, we want to build a visualization project. Specifically, we will first find pivot schools in the collaboration networks in a specific academic field and then create a graph representing these collaboration relationships.
Our dataset was derived from the WOS database. After the necessary data processing approach, there are at least 2 columns left there, which are named “Univ_A” and “Univ_B”. They matched together in a row because the university in “Univ_A” and the university in “Univ_B” once collaborated on a paper.
Based on our dataset, we will construct a graph using an adjacency list. We will firstly use the BFS algorithm to traverse the graph to find if there exists several connected components. Based on connected components, the Brandes Algorithm will be employed to generate the centrality value for each node. The last step is to create a graph by the forced-directed graph drawing algorithm to show relative relationships between schools. The nodes’ position are stablized after balancing the “force” and the edges represent the relative distance according to the net force.
Dataset Acquisition
We derived our data from the WOS database (https://www-webofscience-com.proxy2.library.illinois.edu/wos/woscc/advanced-search). The Web of Science is the world’s most trusted publisher-independent global citation database. Allows us to track ideas across disciplines and time from almost 1.9 billion cited references from over 171 million records.
The search query that we used is:
(WC=(Statistics & Probability)) AND (TMSO==(“9.92 Statistical Methods”)). Where “WC” is stands for “Web of Science Categories”, and “TMSO” is stands for “Citation Topics Meso”. We downloaded 1,000 highly cited articles data.
Data Format
The data format of the raw dataset is “.xls”. It has 72 columns and 1,000 rows, but we’ll only select 1 columns in follow-up work, which are “Affiliations”. We named the dataset “1k_stat_papers.xls”.
But after data cleaning, we changed the format to “.csv”. We named it “data_edge_617.csv” and data_vertex_262.csv.
Data Correction
We use R, a programming language for statistical computing, to do the data cleaning and data correction job. Specifically, We first select only the “Affiliations” column, and then we drop the rows which do not have Affiliations record (NULL Data) or only have 1 author.
A representative row in Affiliations column looks like this:
“University of Wisconsin System; University of Wisconsin Madison; Duke University”
There are 2 data correction processes that we applied:
String split
str_split(";", simplify = TRUE)
Then we will got a matrix with 3 columns:
University of Wisconsin System | University of Wisconsin Madison | Duke University
deduplication:
As you can see from the example, “University of Wisconsin System; University of Wisconsin Madison” is are exactly refer to the same school. So, we decided to remove all duplicate data points. This duplication is usually caused by the US public university system.
find a partner pairs
After string split and dedupe, our example data will looks like this:
University of Wisconsin Madison | Duke University
So we got a partner university pair. This can represent one-time collaboration between these two universities
If there are more than 2 universities in a row, for example we got 4:
univ_A | univ_B | univ_C | univ_D
the matching will be like:
univ_A | univ_B
univ_A | univ_C
univ_A | univ_D
univ_B | univ_C
univ_B | univ_D
univ_C | univ_D
Mathematically, suppose N is an arbitrary school number. The number of pairs it can generate is $N\choose 2$. ${number\ of\ pairs} = \frac{n!}{2!(n-2)!}\quad$
Data Storage
We will convert the dataset from dataframe-based structure to graph-based structure. We will store our data into an adjacency list. In each linked list in an adjacency list, we will store all the vertices that are connected to a single vertex. The time complexity is O(n^2) and space complexity is O(n+m), where n is the number of vertices and m is the number of edges.
Algorithm
We are going to use BFS to do the traversal. The input will be a list of nodes and the output will be a matrix representing the connected components while each line refers to one connected component. The time complexity will be O(V+E), and the space complexity will be O(V).
Secondly, we will use Brandes Algorithm to generate centrality for each node in the graph. For each connected component, we will obtain a node with most centrality in each connected component. A list of nodes of most centrality will be our output. The time complexity is O(nm) and O(n + m) is the space complexity, where m is the number of edges and n is the number of nodes.
Define σ(s, t) as the number of shortest paths between nodes s and t. Define σ(s, t|v) as the number of shortest paths between nodes s and t that pass through v. Betweenness centrality is CB(v) = sigma(σ(s, t|v) / σ(s, t))
This will be our main algorithm to find pivot schools (most influential) for each academic circles.
Lastly, we will use forced-directed graph drawing to draw a graph representing the relationships between school and their collaboration. We calculate attractive and repulsive forces between the nodes in the graph and use the net forces to update each node’s position. The mass of a node is determined by betweenness centrality. We use the Fruchterman-Reingold algorithm to calculate these forces where the attractive force is inversely related to the square of the nodal distance and the repulsive force is inversely related to the nodal distance. Therefore, our input is a list of centralities and random 2-d coordinates, and our output is a graph with stable nodes, and the edges represent the relative distance according to the net force. The time complexity is O(n^3) and space complexity is O(n),where n is the number of nodes.
Timeline
11/4/22 Complete team contract and project proposal, Create GitHub repo
11/13/22 Acquire and correct data
11/18/22 Setup files, transfer data to graph
11/25/22 Implement the BFS, and implement betweenness centrality algorithm
12/03/22 Draw force-directed graph. Debug, write the report and perform presentation
12/12/22 Write the report and record a presentation, re-check our code, and post it on GitHub
This repository is a template for creating an Aries Verifiable Credential Registry (VCR) Issuer Agent. Aries VCR is the foundational technology upon which the Government of British Columbia’s OrgBookBC was built. Aries VCR Issuer Controller is a starter kit for building an Aries agent that issues verifiable credentials to instances of an Aries VCR, such as OrgBookBC. This repo contains code for an issuer controller that works with Aries Cloud Agent Python (ACAPy) framework. The controller and an instance of ACA-Py can be deployed together to implement an Aries issuer agent.
aries-vcr-issuer-controller was developed as part of the Verifiable Organizations Network (VON). For more information on VON, visit https://vonx.io. Even better, join in with what we are doing and contribute to VON and the Trust over IP community.
Still not sure what this is? Please see this Getting started with VON overview, paying particular attention to the VON Issuer/Verifier Agent section. That’s what this repo implements.
Terminology
Aries VCR Issuer Controller or Agent
Aries Agents consist of two parts, a framework that handles all of the Aries agent type functions (e.g. messages, protocols, protocol state, agent storage, etc.) and a controller that provides the business logic that gives the agent personality. As such, we talk about the code in this repo as the Controller. When the controller code is deployed along with an instance of an agent framework—ACA-Py—we have an Aries VCR Issuer agent. As such, in this repo we might talk about the code in this repo (the Aries VCR Issuer Controller), or talk about a deployed and running Aries VCR Issuer Agent.
Make sense?
Aries VCR vs. OrgBook
A question we often get is what’s the difference between OrgBook and Aries VCR? Here are the details.
The OrgBook is a specific instance of Aries VCR about registered organizations within a legal jurisdiction (e.g. province, state or nation). Each entity in an OrgBook is a registered organization (a corporation, a sole proprietorship, a co-op, a non-profit, etc.), and all of the verifiable credentials within an OrgBook repository relate to those registered organizations.
So while OrgBook is an instance of the Aries VCR software, Aries VCR itself knows nothing about jurisdictions, registered organizations, etc. As a result can be used in many credential registry use cases. If the entities within an Aries VCR instance were doctors, then the verifiable credentials would all be about those doctors, and we’d have “DocBook”. Same with engineers, lawyers, teachers, nurses and more. If an Aries VCR instance had construction sites as top level entities, the verifiable credentials would all be about those construction sites, such as permits, contractors, contracts, payments and so on.
Aries VCR knows about verifiable credentials, how to hold them, prove them and how to make the available for searching based on the values in the claims. What is in those credentials is up to the issuers that issue to that instance of an Aries VCR.
We often talk about the OrgBook being a repository of public credentials, and that OrgBook is publicly searchable. However, instances of Aries VCR do not have to contain public credentials and the website does not have to be publicly accessible. An organization could implement an instance of an Aries VCR, load it with with credentials containing proprietary data and wrap it with a mechanism to allow only authorized entities to access the data.
Much of the work in configuring an Aries VCR Issuer Agent is in setting up the YAML files in the issuer_controller/config folder. A Configuration Guide documents those files.
Managing Your Controller Repo
If you are creating an agent for a service organization that will become an Aries VCR Issuer/Verifier agent, most of the changes you will make in this repo will be for your own organization’s use and will not be pushed back into the base repo. As such, we suggest you use one of following methods for managing this repo. We recommend the first method, but would welcome suggestions of other approaches that might have more upside and less downside. Please add an issue to tell us about a better way.
Make a snapshot (not a fork or clone – a text copy) of this repo to use as the base repo for your organization’s agent from there. The benefit of that approach is that your developers can fork the snapshot repo and manage everything through the common GitHub Pull Request (PR) model. The downside is that periodically you should look for code updates to this (aries-vcr-issuer-controller) repo and apply them to your copy. There are relatively easy ways to track such changes, such as keeping a fork of aries-vcr-issuer-controller, using GitHub’s compare capability to find the differences and manually applying the relevant ones to your repo.
Make a fork of this repo, and in that, create a branch that you will use as the deployment branch for your agent instance. The benefit of this approach is that you can stay up-to-date with the base repo by applying commits to your branch from the master. The downside is a much more complex branching model for your developers and a non-typical deployment model for your code.
In theory, the two mechanisms above can be combined, and branches could be created in the main repo for the different agent instances. This might be an approach that, for example, the BC Gov could use—creating a branch for each OrgBookBC Issuer agent in BC Gov. However, we think that the benefits of such a scheme is not worth the complexity.
Running Locally in “dev” mode
When you run everything locally (von-network, aries-vcr and the issuer/controller), your issuer will automatically establish a connection between your agent and the OrgBook agent. There are two settings that control this behaviour:
REGISTER_TOB_CONNECTION - set to "true" (the default) to auto-connect to the TOB agent
TOB_AGENT_ADMIN_URL - set to the TOB agent admin API url (the default setting) to allow the issuer controller to request an invitation
(If REGISTER_TOB_CONNECTION is not trueor the TOB_AGENT_ADMIN_URL is not set then the issuer /controller will not auto-connect.)
Once the issuer/controller has started and completed initilization then credentials can be issued to OrgBook.
Deploying Your Issuer Controller on OpenShift
When you are running locally, your issuer controller will automatically establish a connection between your agent and the OrgBook agent. However when you deploy on OpenShift and connect to one of the OrgBook environments (dev, test or prod) this is not possible, and the agent connection must be established manually. The two settings mentioned in the previous section must be set (leaving TOB_AGENT_ADMIN_URL unset is sufficient).
The following steps are required:
Request an Invitation from the OrgBook agent: /connections/create-invitation
(Depending on your agent startup parameters) Accept this invitation through your agent /connections/<conn_id>/accept-invitation. (if your aca-py agent is started with --auto-accept-invitation then you don’t need to do this step)
Verify your connection status
To test this process on a local installation (i.e. your local workstation), use the following startup command:
REGISTER_TOB_CONNECTION=false ./manage start
This will startup your Issuer Controller without an orgbook connection and you will need to follow the above steps. Once the connection is established your Issuer will be registered with your local OrgBook. You cannot issue credentials to OrgBook until you have established a connection between your agent and the OrgBook agent, and your issuer has registered itself with OrgBook.
Getting Help or Reporting an Issue
To report bugs/issues/feature requests, please file an issue.
How to Contribute
If you find this project helpful, please contribute back to the project. If you would like to contribute, please see our CONTRIBUTING guidelines. Please note that this project is released with a Contributor Code of Conduct. By participating in this project you agree to abide by its terms.
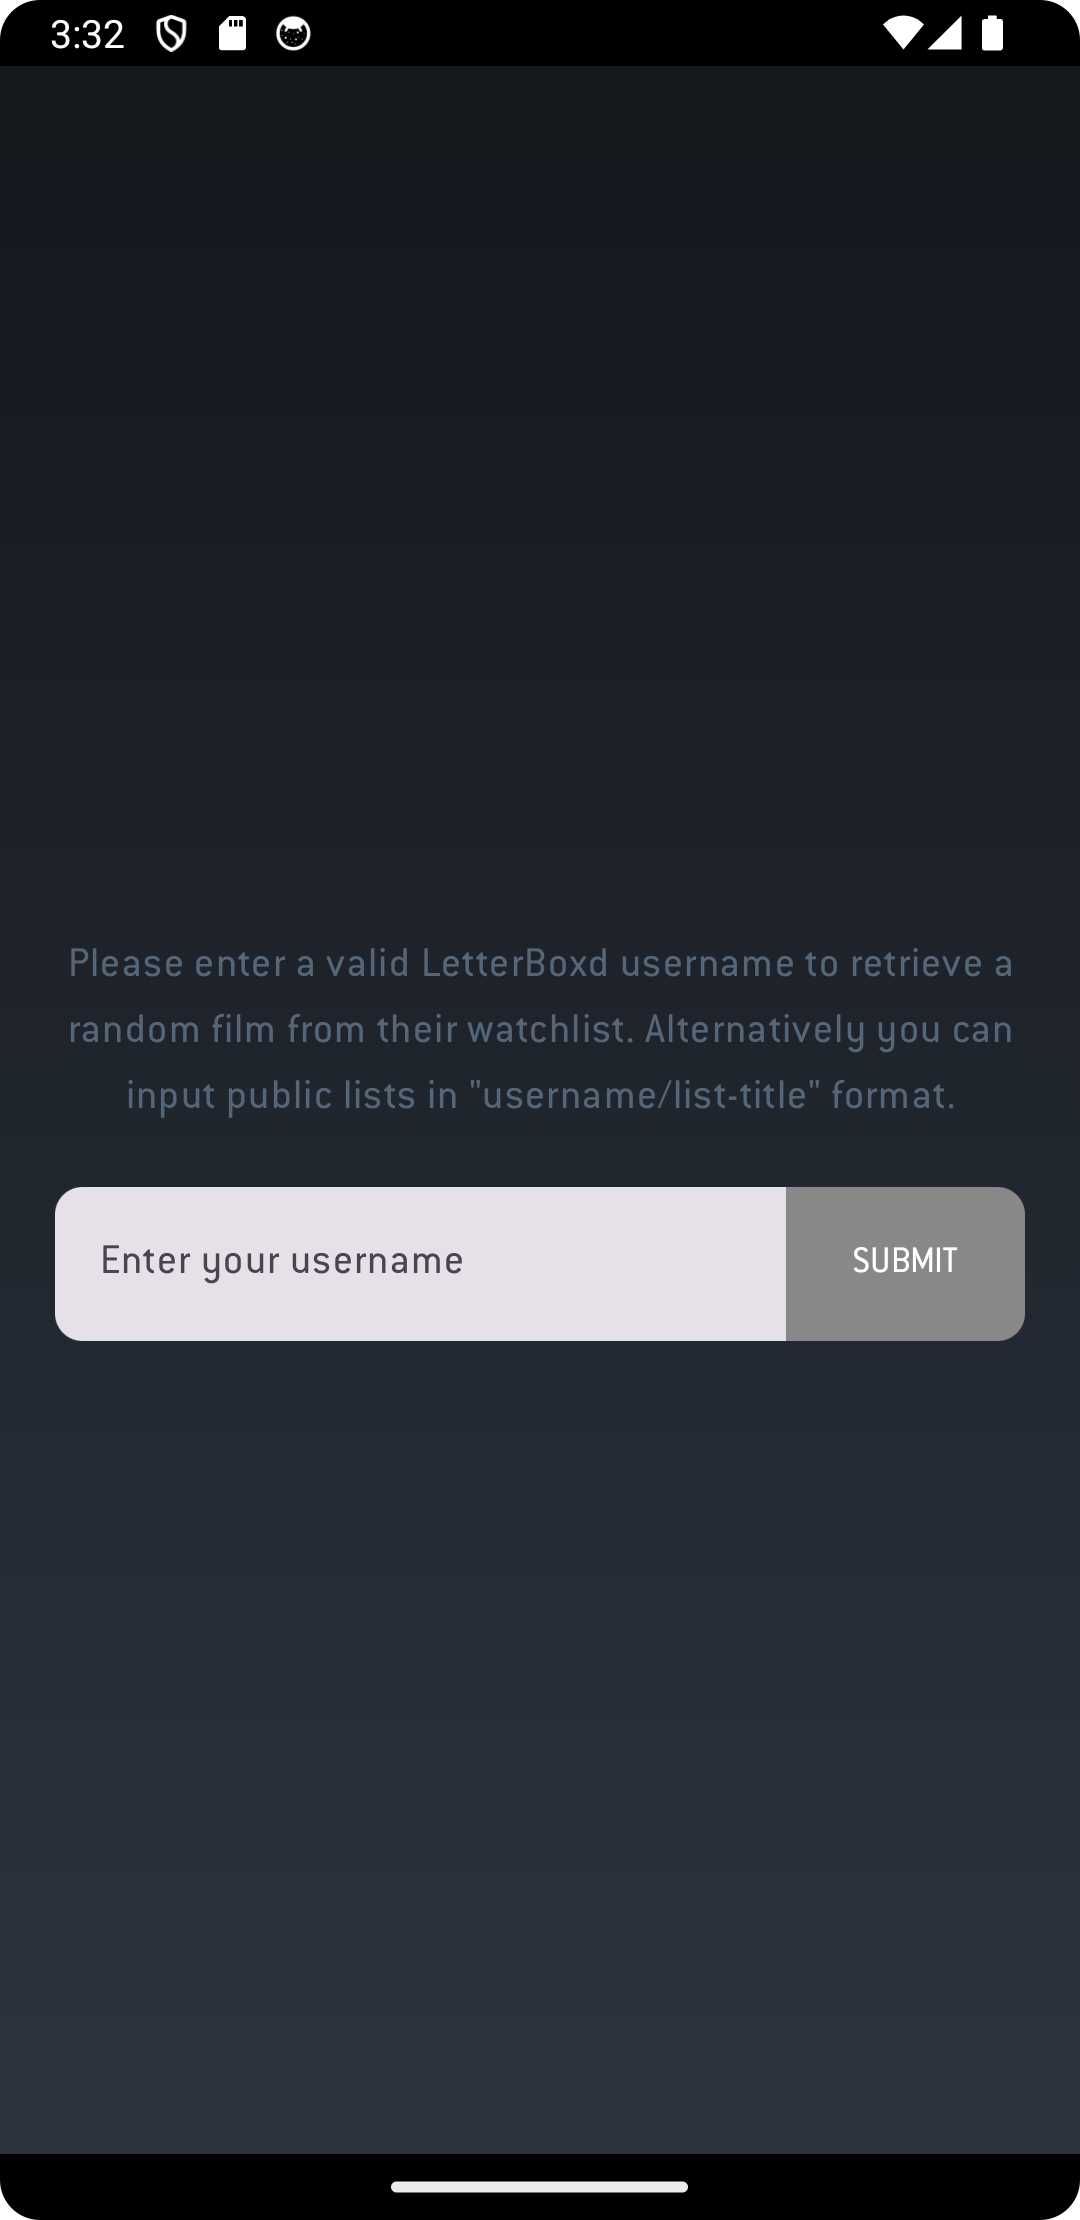
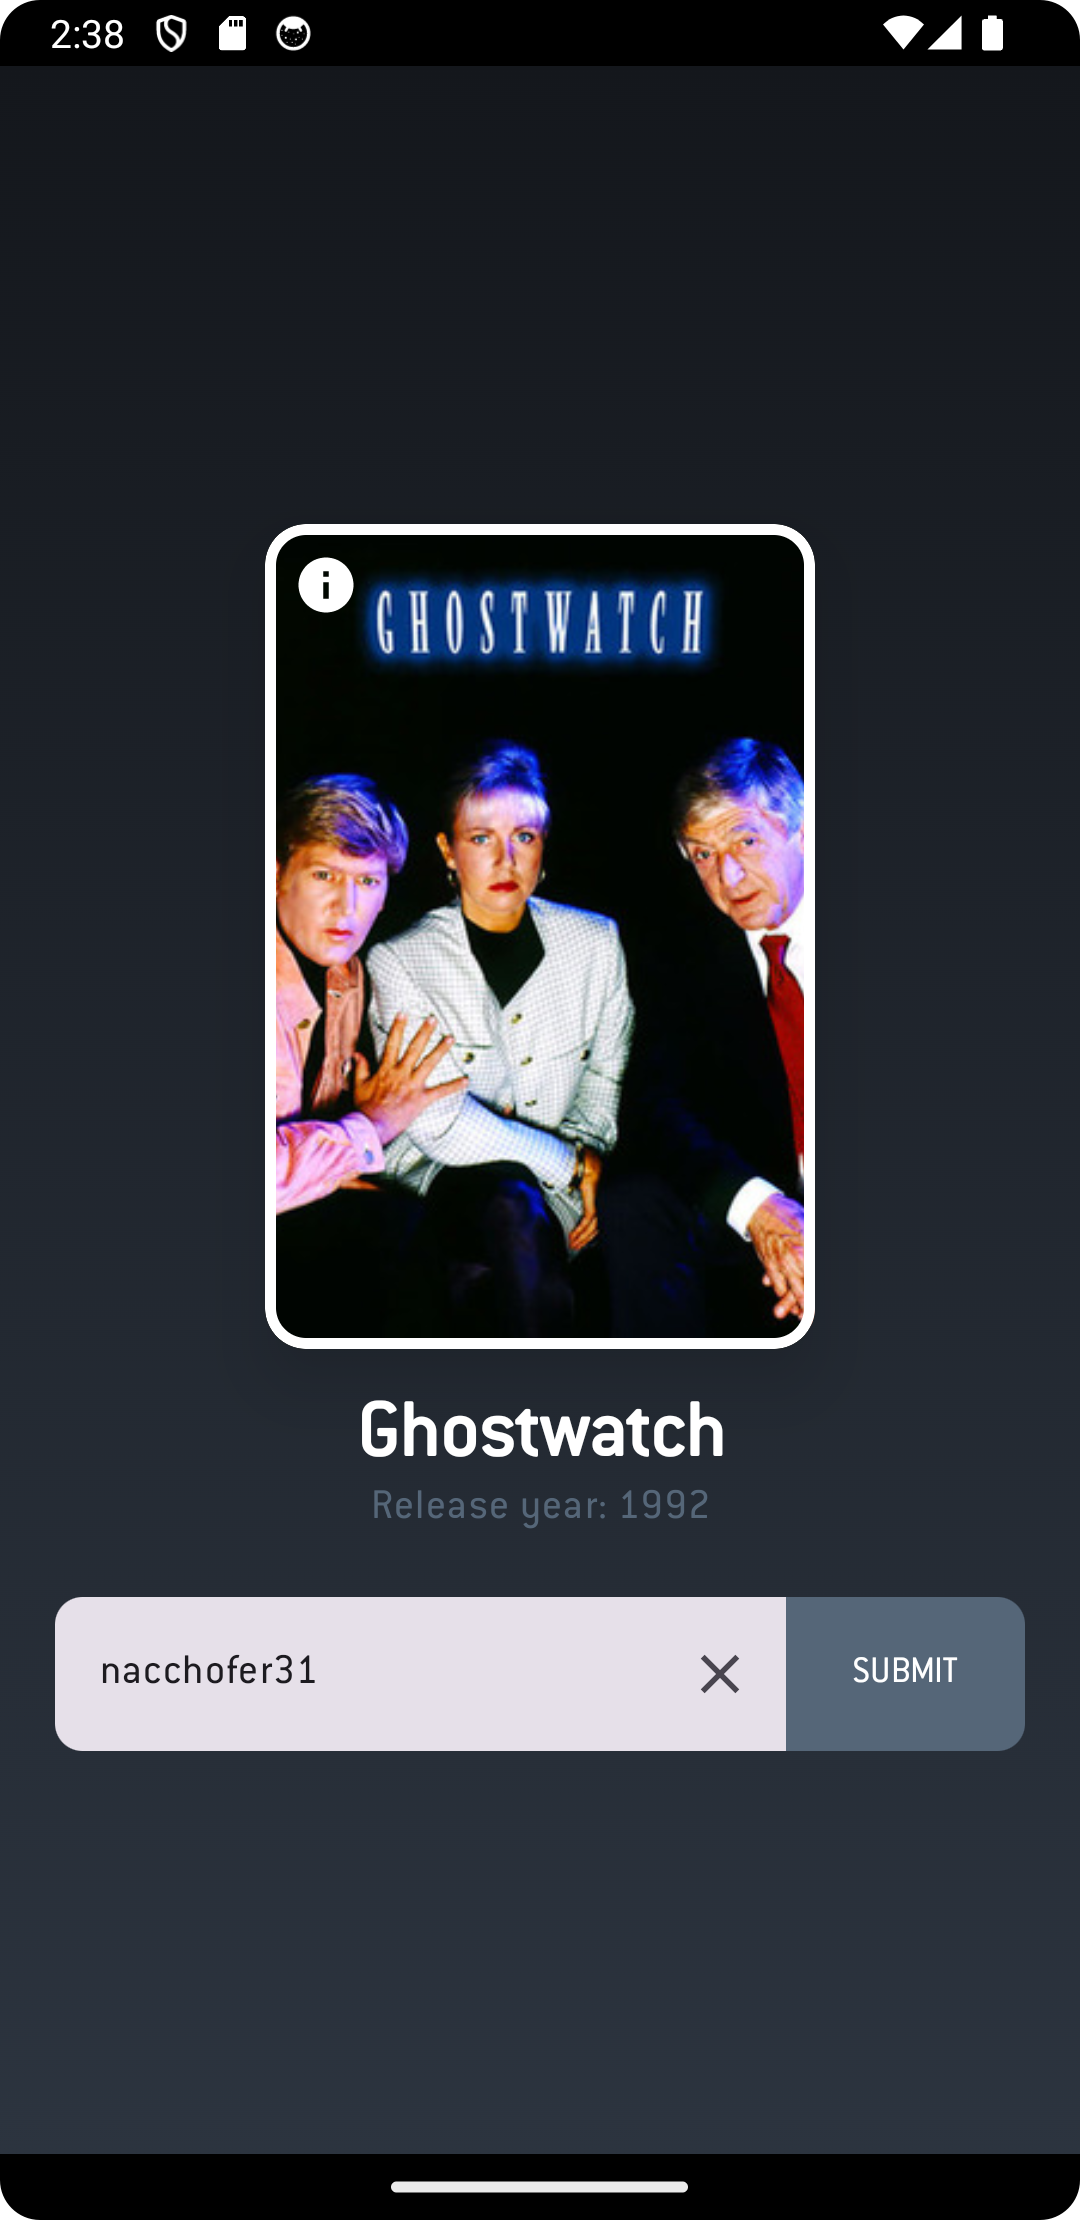
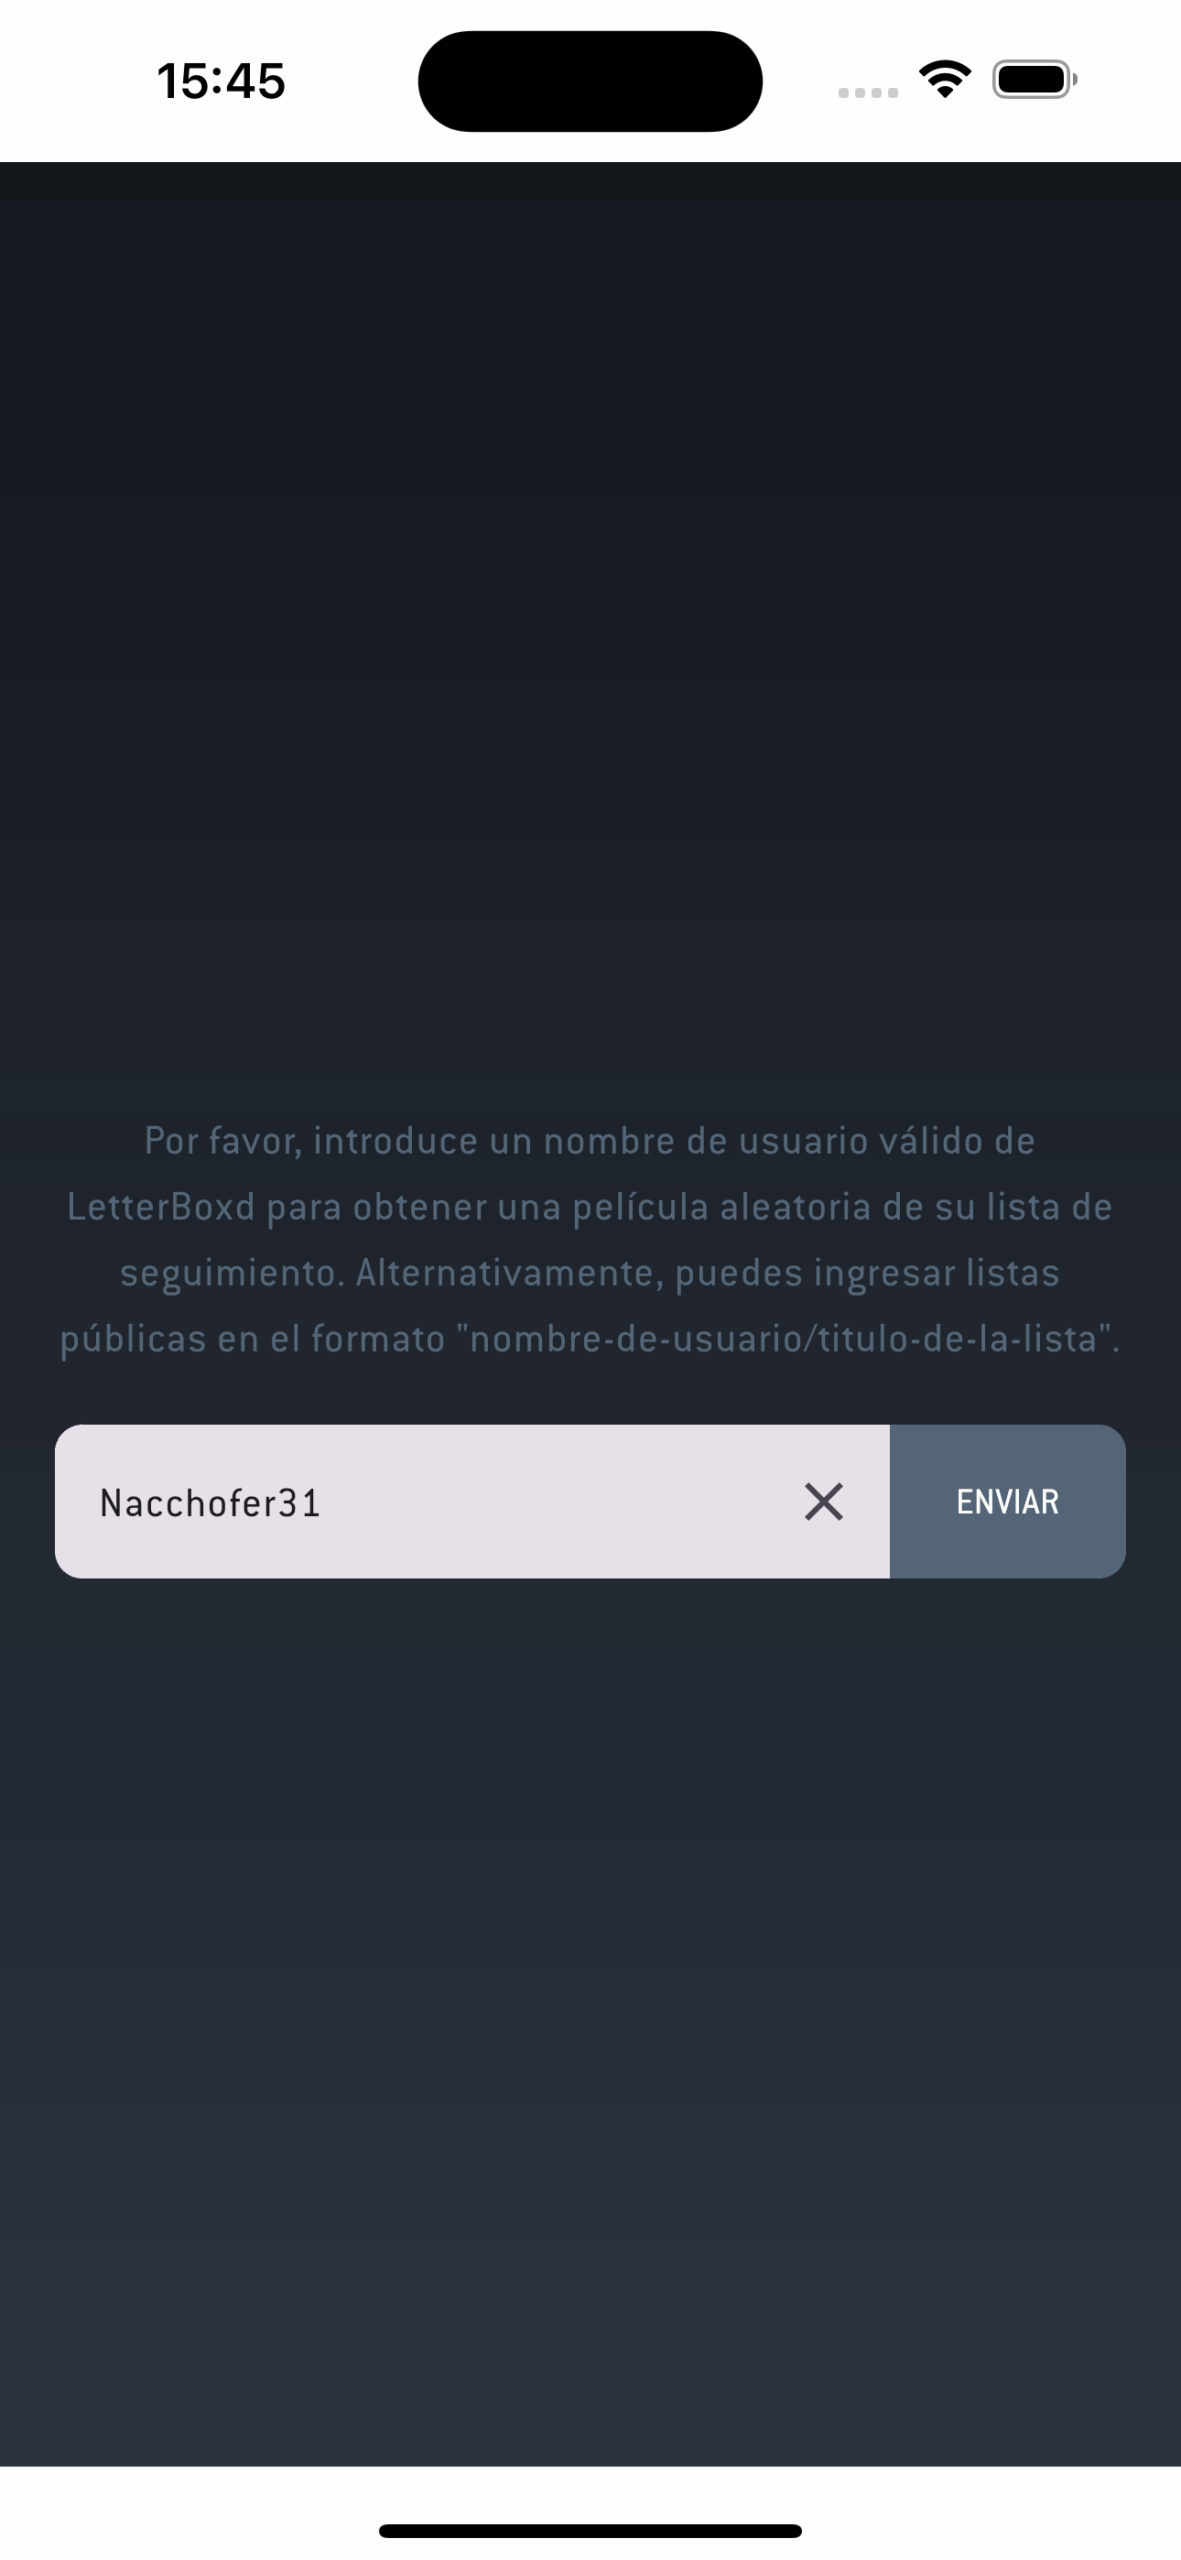
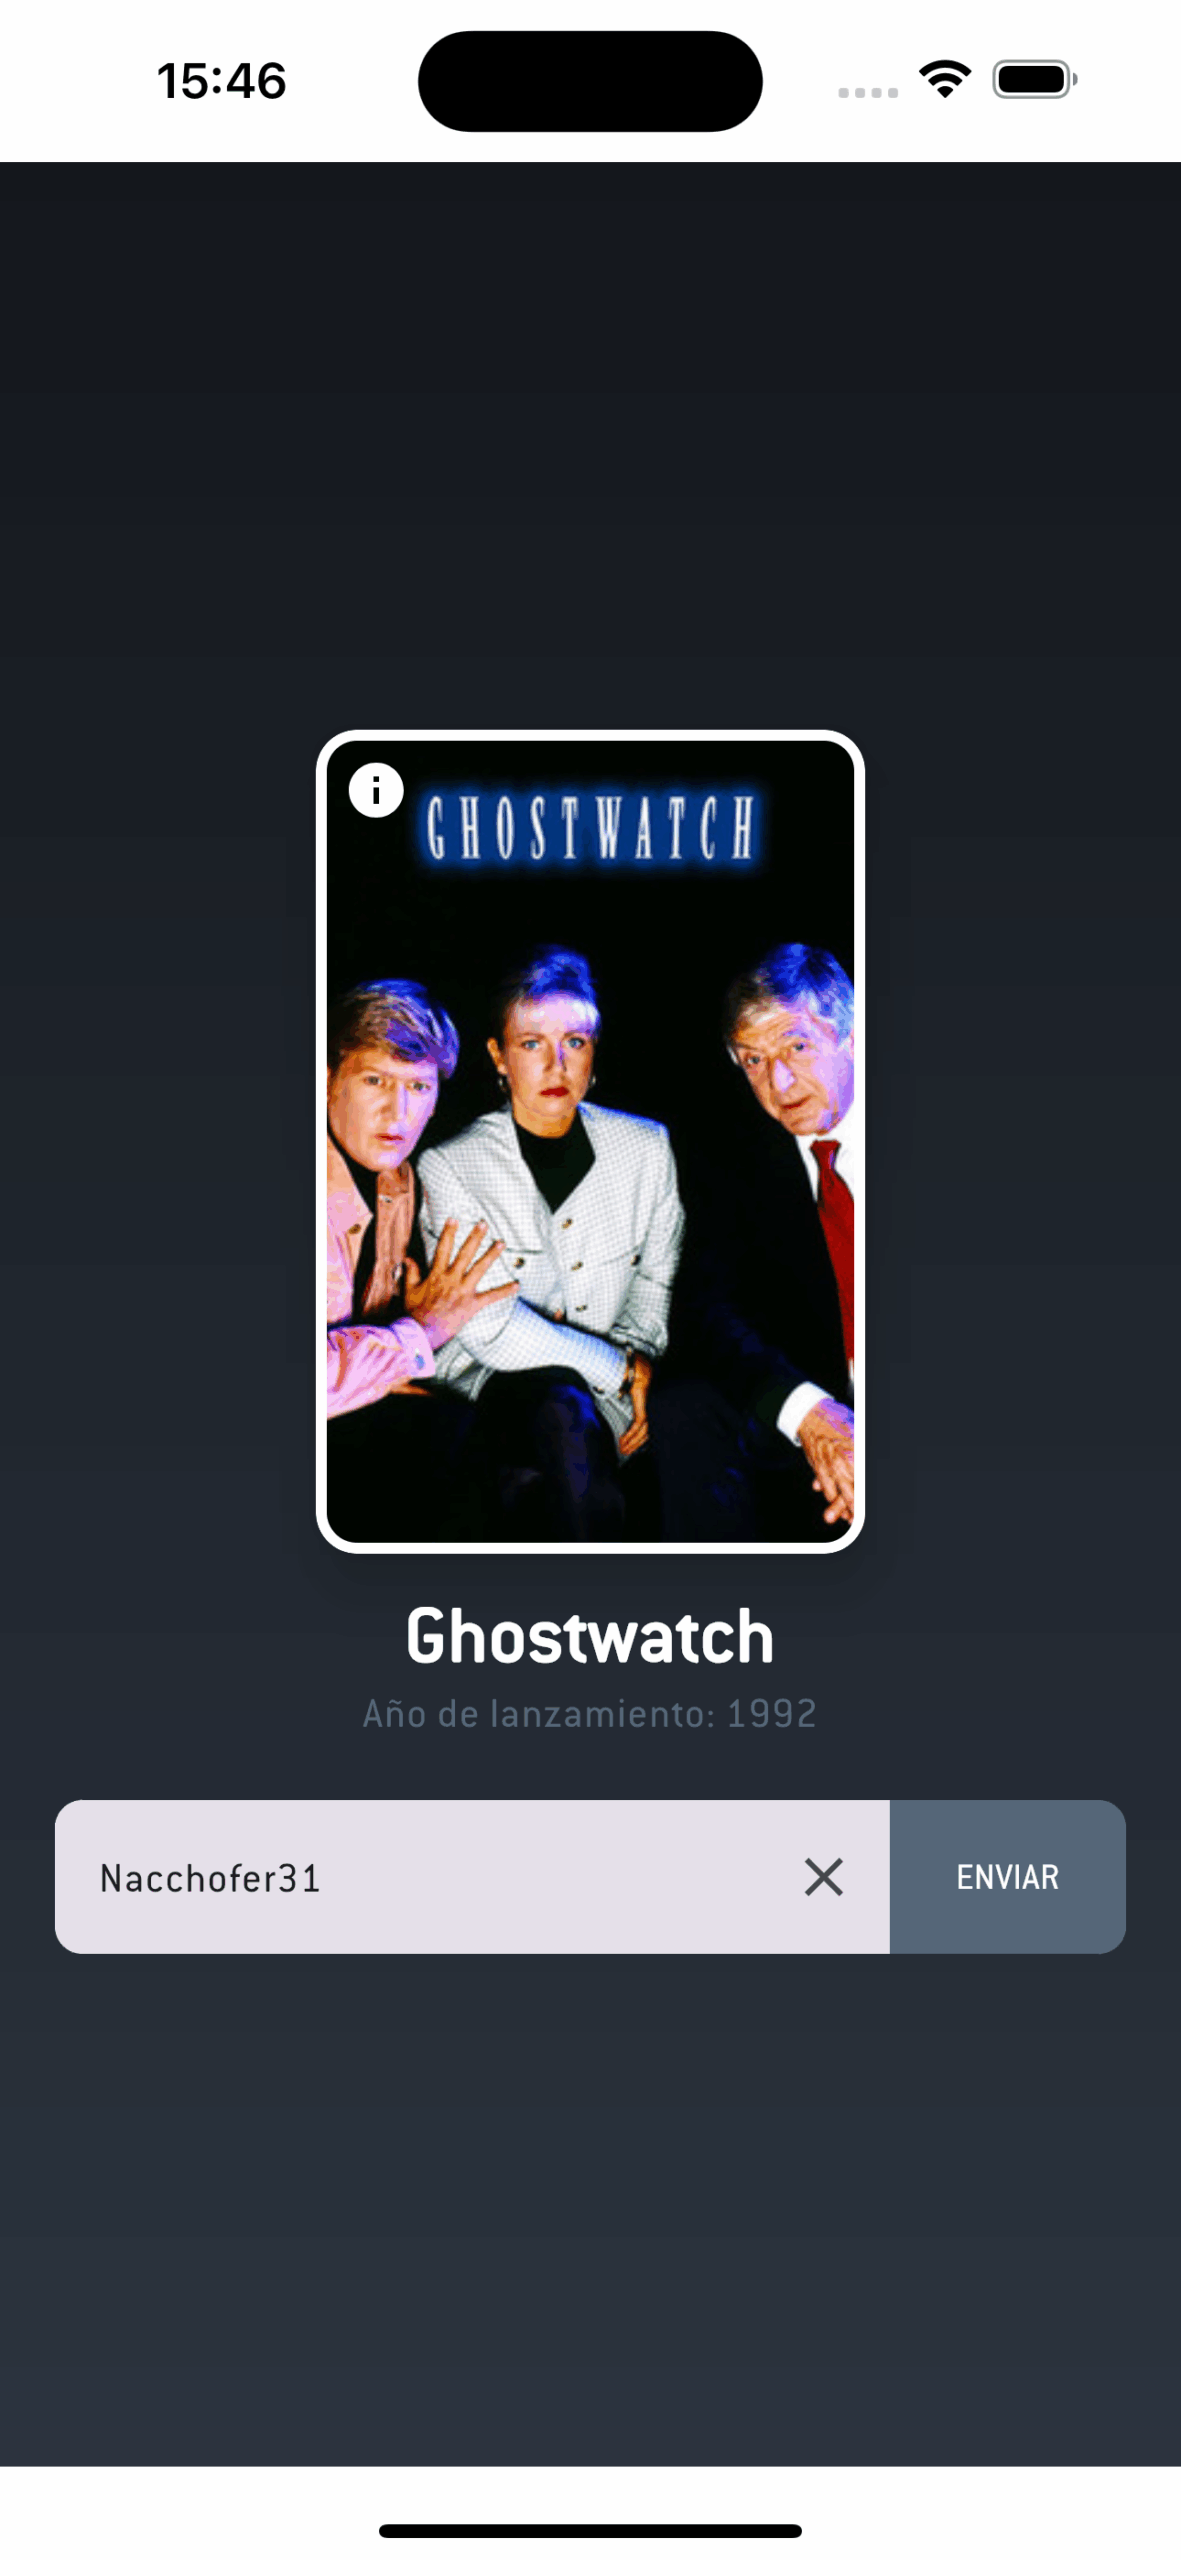
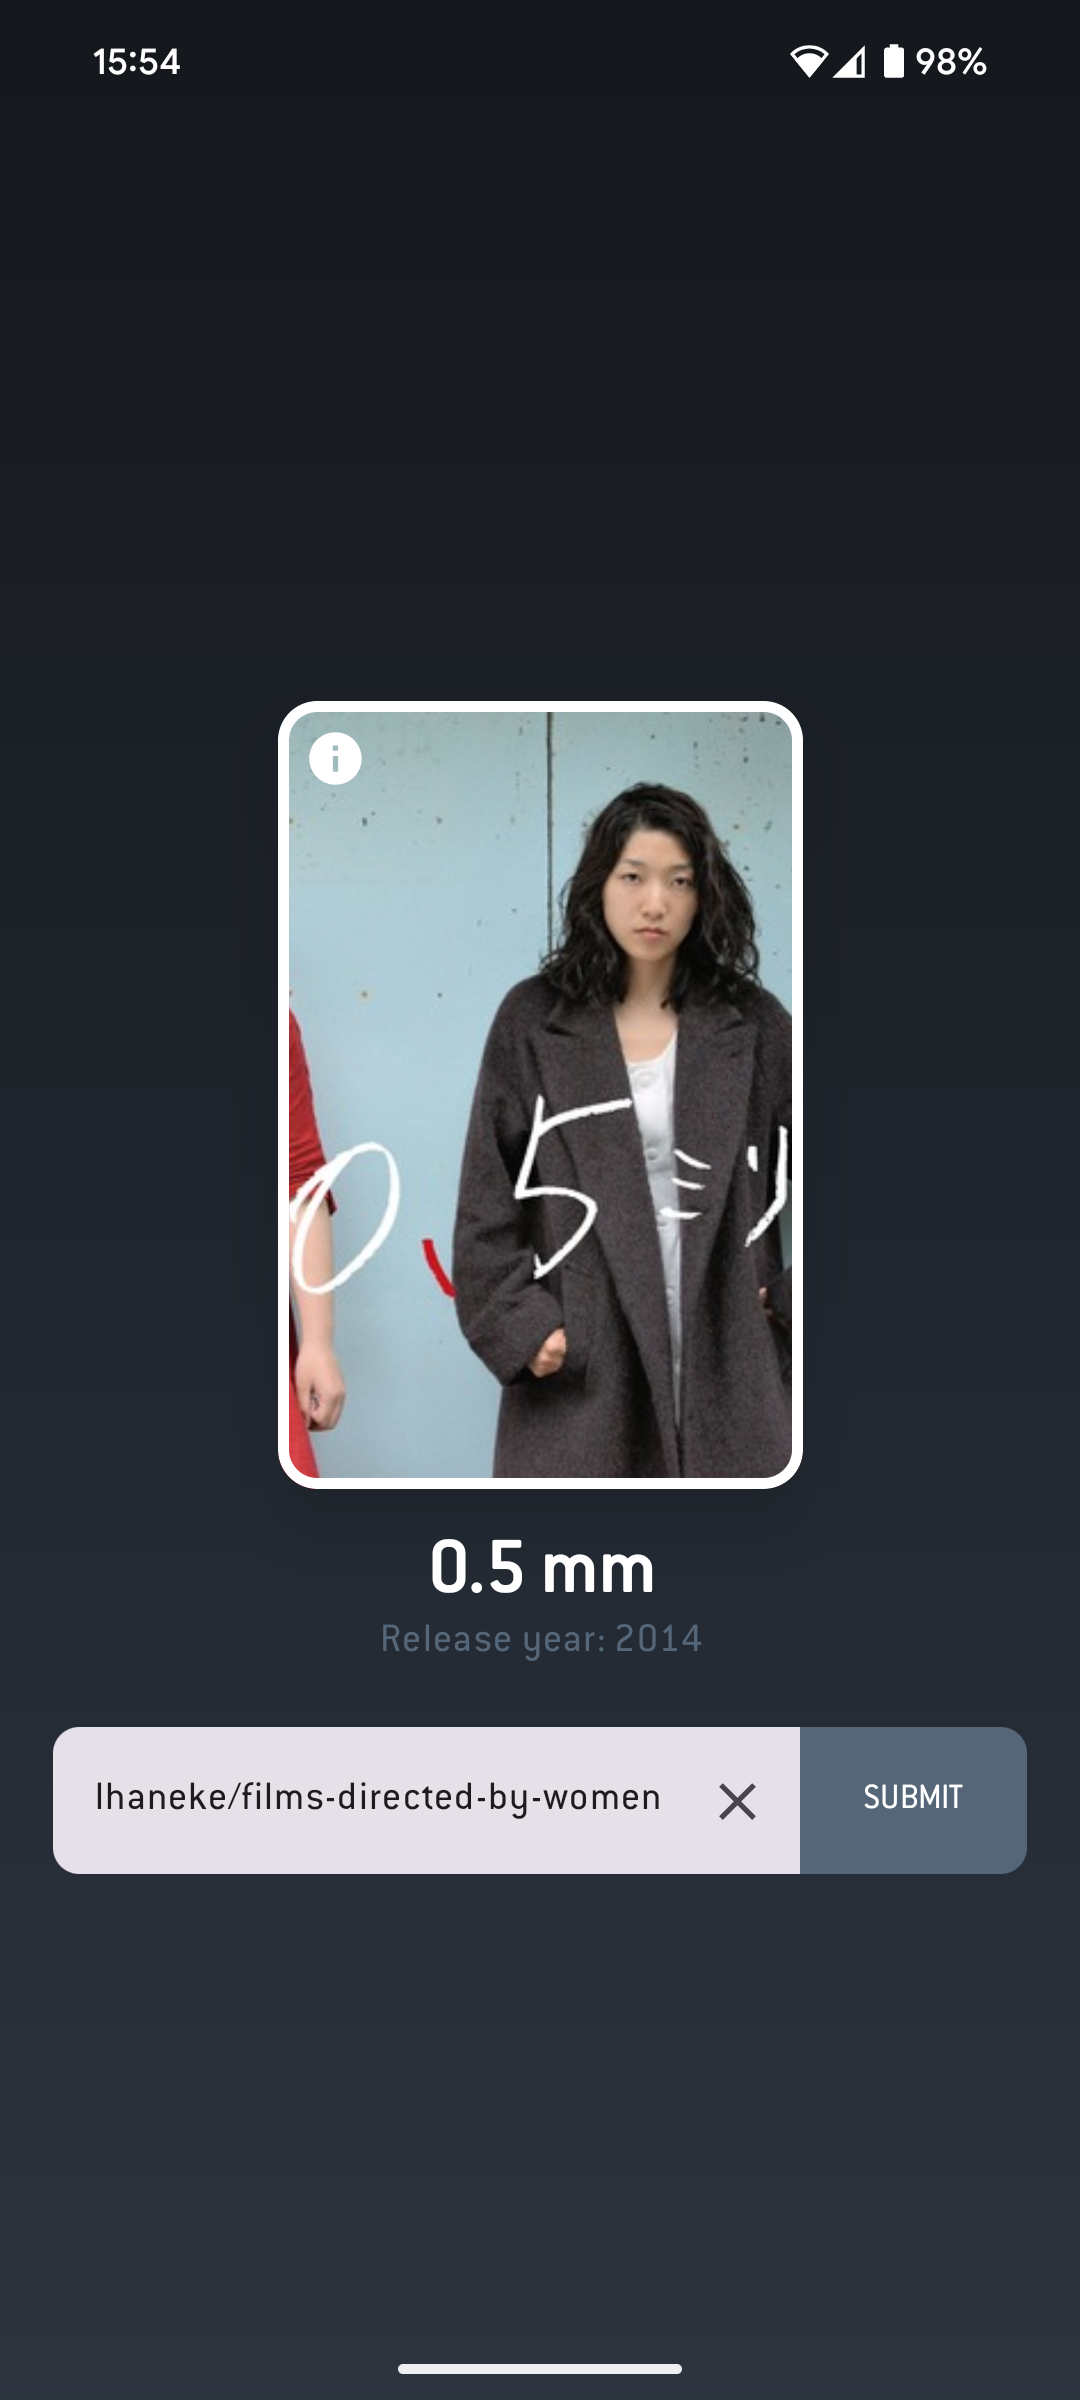
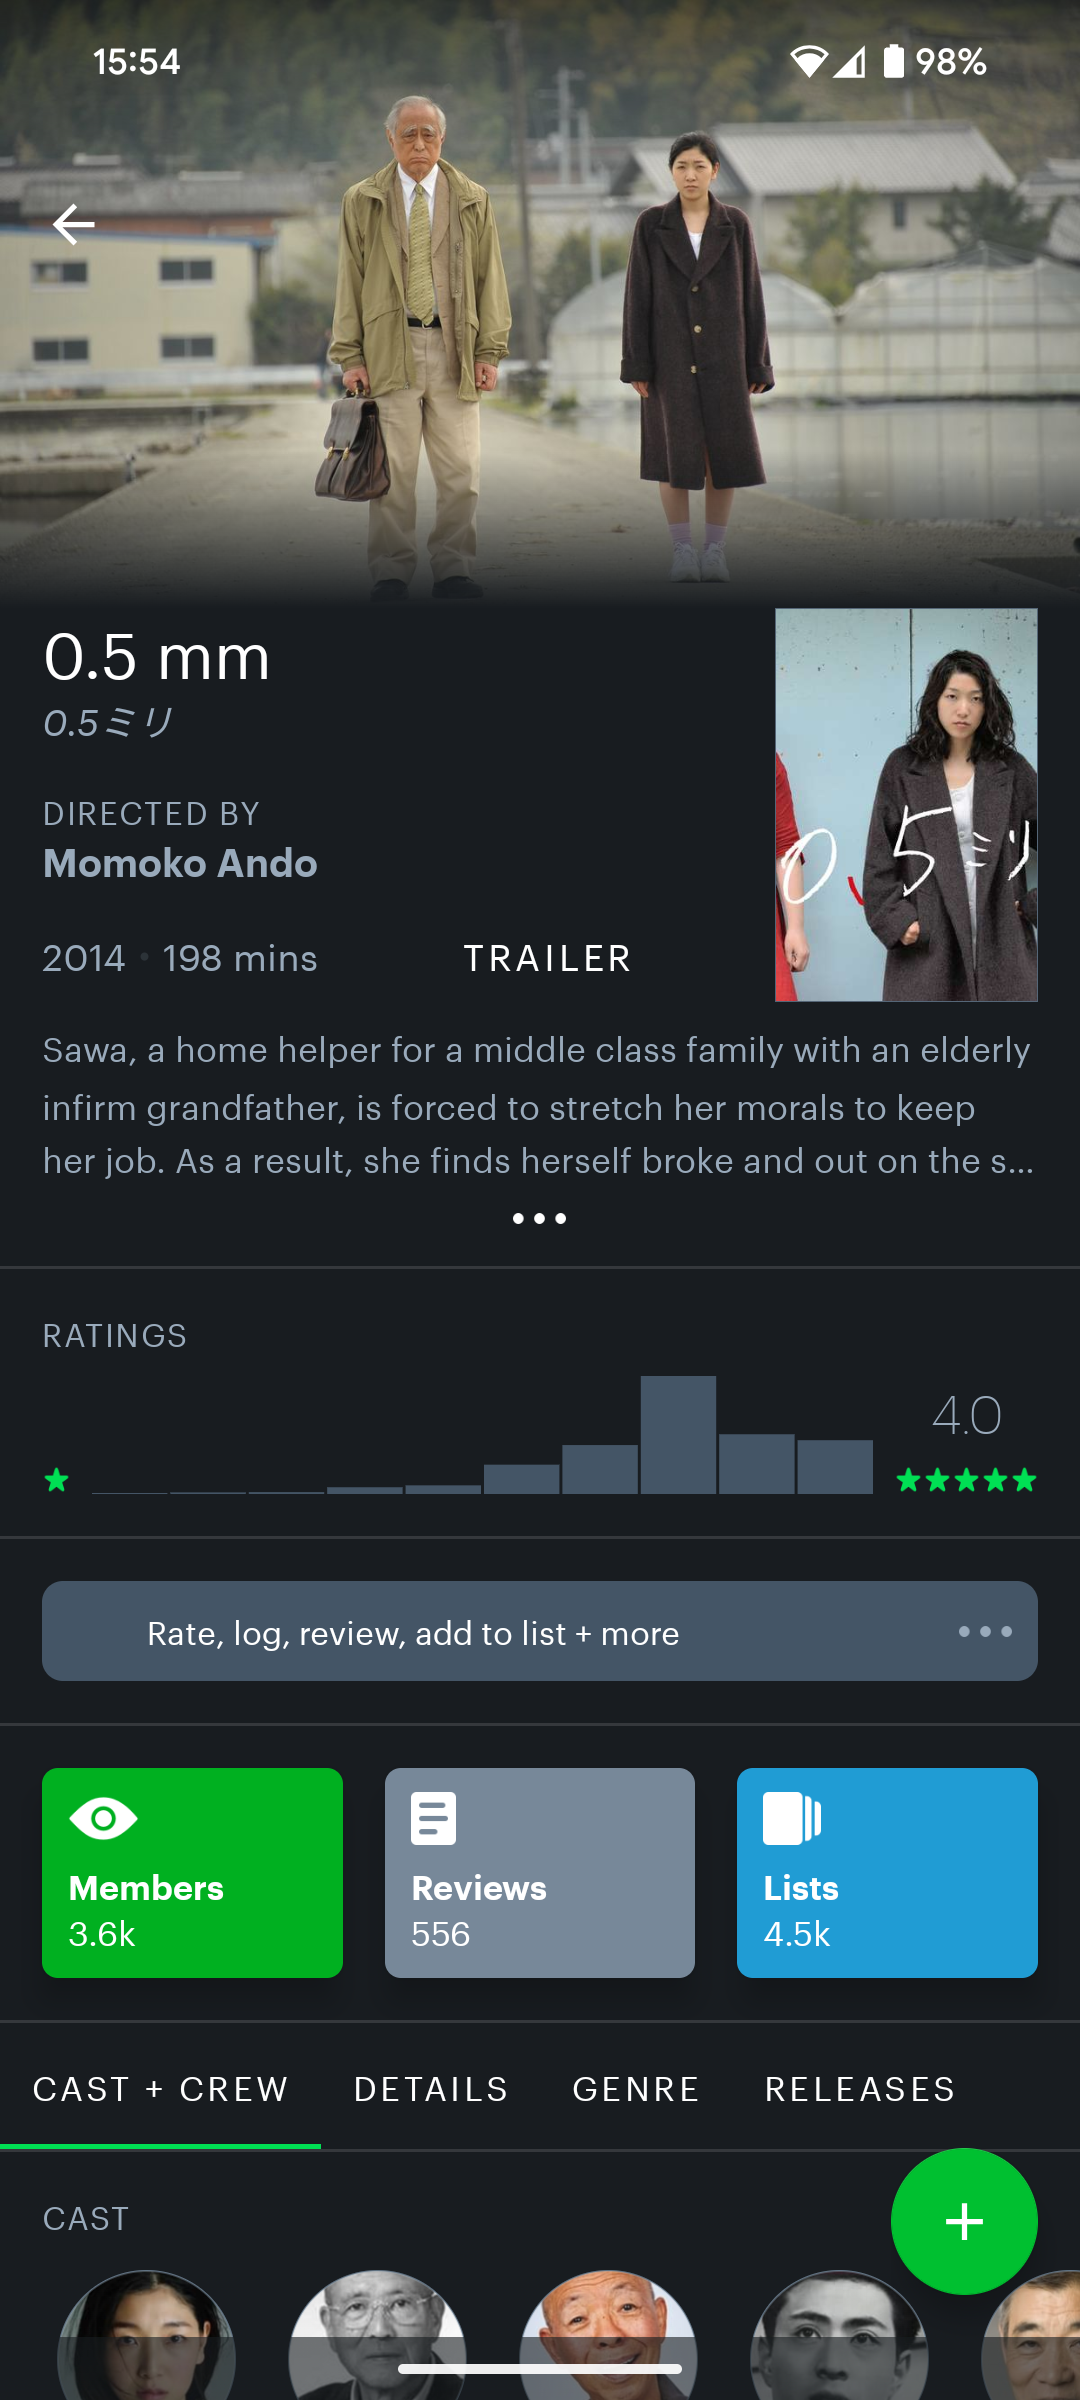
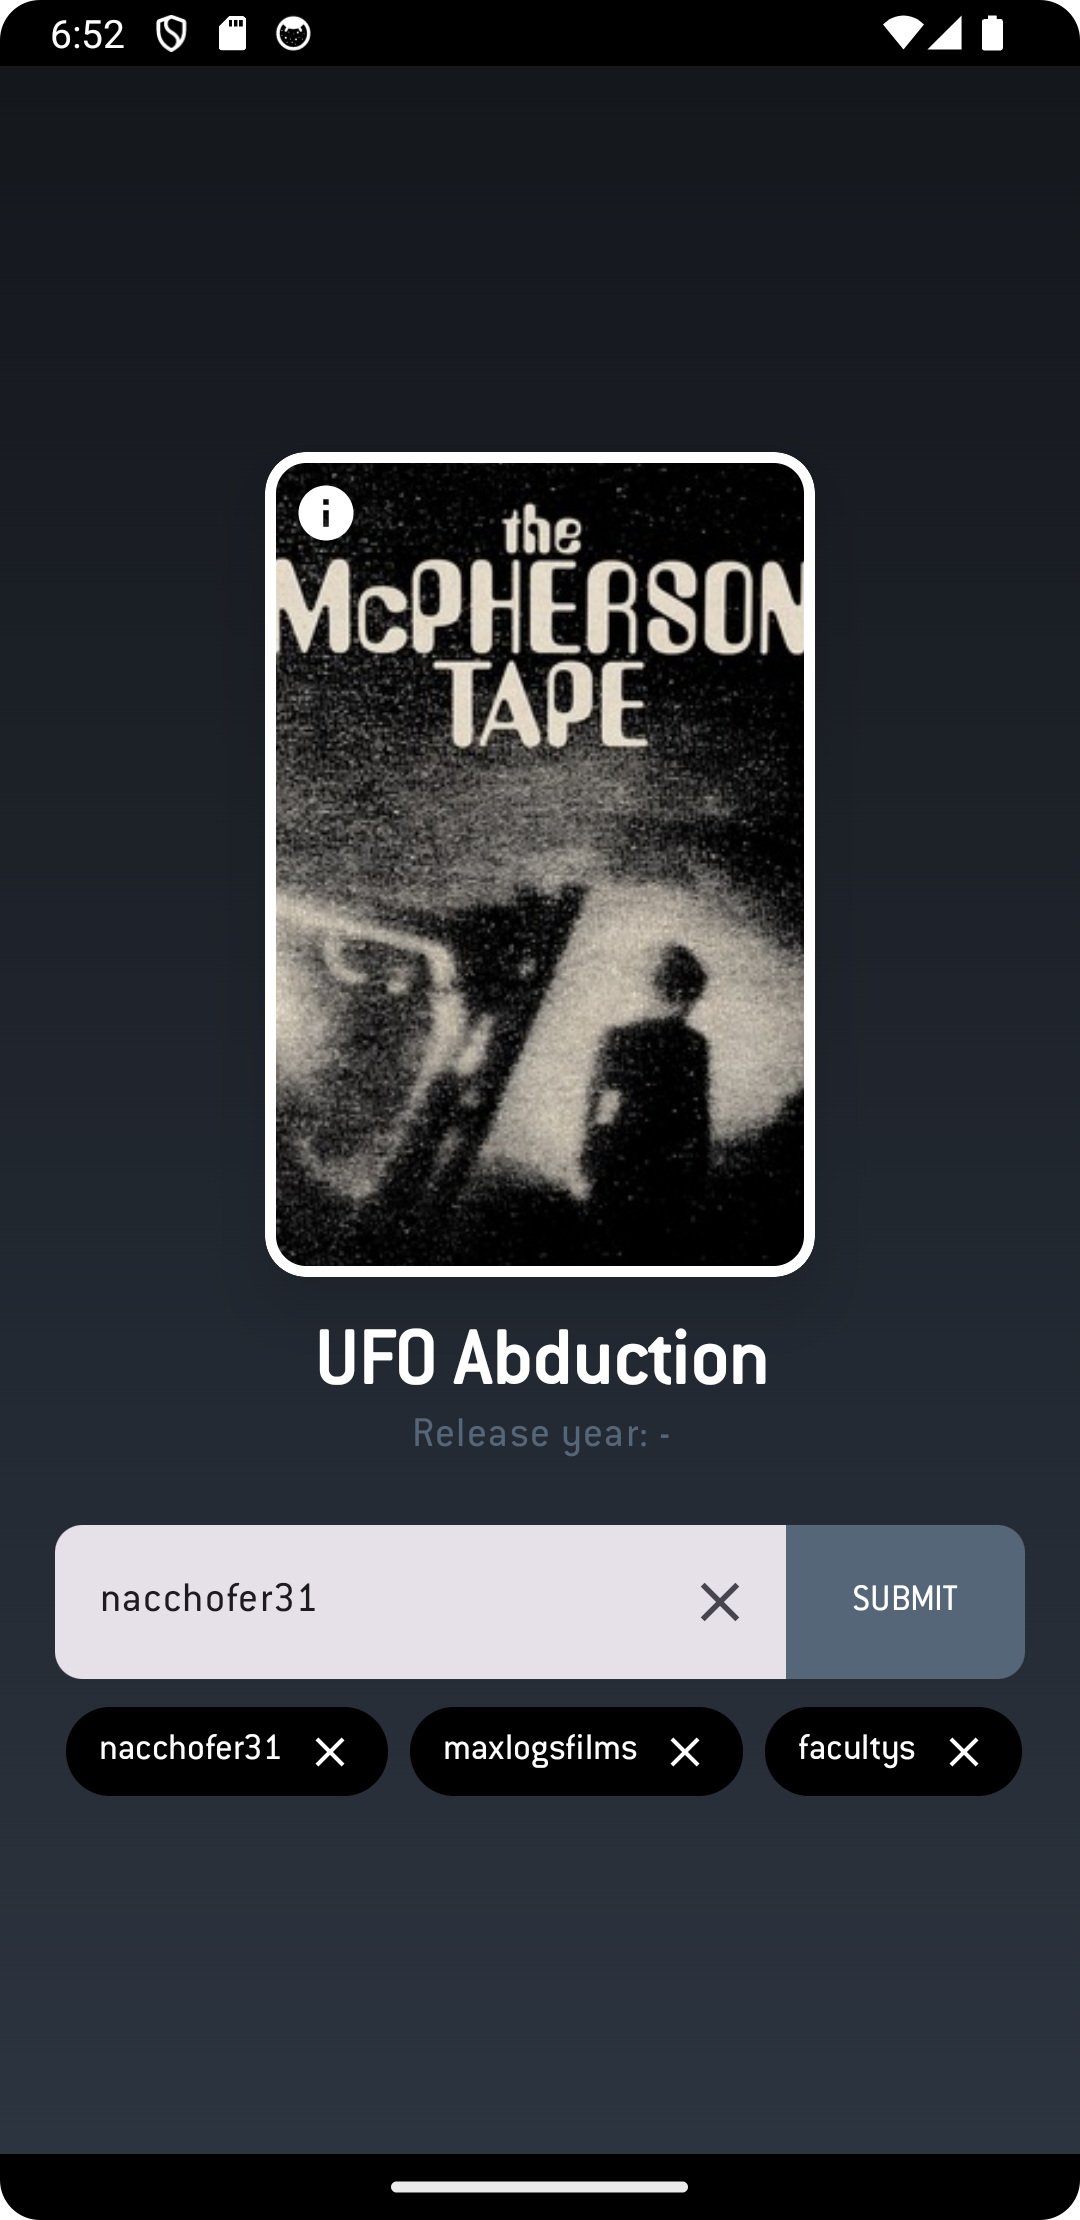
RandomBoxd is a Kotlin Multiplatform project designed to fetch a random movie from a Letterboxd user’s watchlists or custom lists. This app is built for Android and iOS devices. 📱🎬
✨ Features
🎲 Fetch a random movie from a Letterboxd user’s watchlist or custom lists.
📱 Supports Android and iOS platforms.
🔗 Seamless deep linking with the Letterboxd app.
🔍 Intuitive user search functionality.
🏷️ Stores and displays previously entered UserNames locally via Room, shown as tappable tags for quick reuse or deletion.
🏗️ Project Architecture
This project follows the Clean Architecture principles to ensure a scalable and maintainable codebase.
🏛️ KMP Structure
/composeApp is for code that will be shared across your Compose Multiplatform applications.
commonMain contains code common for all targets.
Other folders include platform-specific code (e.g., iosMain for iOS-specific code like CoreCrypto integration).
/iosApp contains iOS applications.
Even if you’re sharing UI with Compose Multiplatform, this folder is the entry point for the iOS app.
This is also where you can add SwiftUI code if needed.
🔧 Tech Stack
Kotlin Multiplatform Mobile (KMP) – Shared logic for Android and iOS.
Jetpack Compose – UI for Android.
Ktor – Network requests.
Coroutines & Flow – Asynchronous programming.
Koin – Dependency Injection.
Coil – Image loading.
Room – Database.
Navigation Compose – Jetpack Compose navigation.
Kotlinx Serialization – JSON serialization.
Spotless – Code formatting.
Junit5 – Unit testing.
Turbine – State testing.
Jacoco – Code coverage.
🌍 Localization Support
RandomBoxd is built with full localization support, allowing the app to be translated into any language.
🏳️ Uses Kotlin Multiplatform’s localization tools for seamless translations.
📝 Supports dynamic text updates based on user preferences.
🌐 Easily adaptable for different regions and languages.
✅ Testing
RandomBoxd’s codebase is tested with:
🧪 JUnit5 for unit tests.
🌊 Turbine for verifying Kotlin Flow emissions and state changes.
🔌 Ktor Client Mock for mocking and testing network requests.
📈 Jacoco to measure and ensure code coverage across the project.
Go Web Server with Kafka Producer and Consumer using Fiber
This is a simple Go web server that implements a Kafka producer and consumer using the Fiber web framework. The server has two endpoints: one for sending data to the Kafka producer and another for receiving data from the Kafka consumer.
Prerequisites
Before running the application, you need to have the following installed:
If You want to consume and print messages from the Kafka topic in real-time, starting from the beginning of the topic, while connecting to the Kafka broker running on localhost:9092. run the following command in another terminal:
To run the application, execute the following command:
go run main.go
The server will start listening on http://localhost:3000.
Endpoints
To send data to the Kafka producer, make a GET request to the /producer endpoint with a message as a parameter.
// GET METHOD
http://localhost:3000/producer/:message
To receive data from the Kafka consumer, make a GET request to the /consumer endpoint. The endpoint will respond with the last received message from the Kafka consumer or a default message if no message is available within 4 seconds.
// GET METHOD
http://localhost:3000/consumer
How it Works
The application uses the Fiber web framework to handle HTTP requests. When a client sends a GET request to the /producer endpoint with a message, the message is sent to the Kafka producer via the producerMessages channel.
The Kafka producer, running in a separate goroutine, reads messages from the producerMessages channel and sends them to the Kafka topic. The producer introduces a random delay between 1 to 3 seconds for message push to simulate real-world scenarios.
The Kafka consumer, also running in a separate goroutine, continuously listens for new messages from the Kafka topic. When a new message is received, it is added to the internal messages slice using a mutex to ensure concurrent-safe access.
The /consumer endpoint, upon receiving a GET request, checks the consumerMessages channel for any available message within 4 seconds. If a message is available, it is sent as a response. Otherwise, a default message is sent indicating that no messages are available at the moment.
The global counter counter is used to keep track of the messages sent to the Kafka producer.

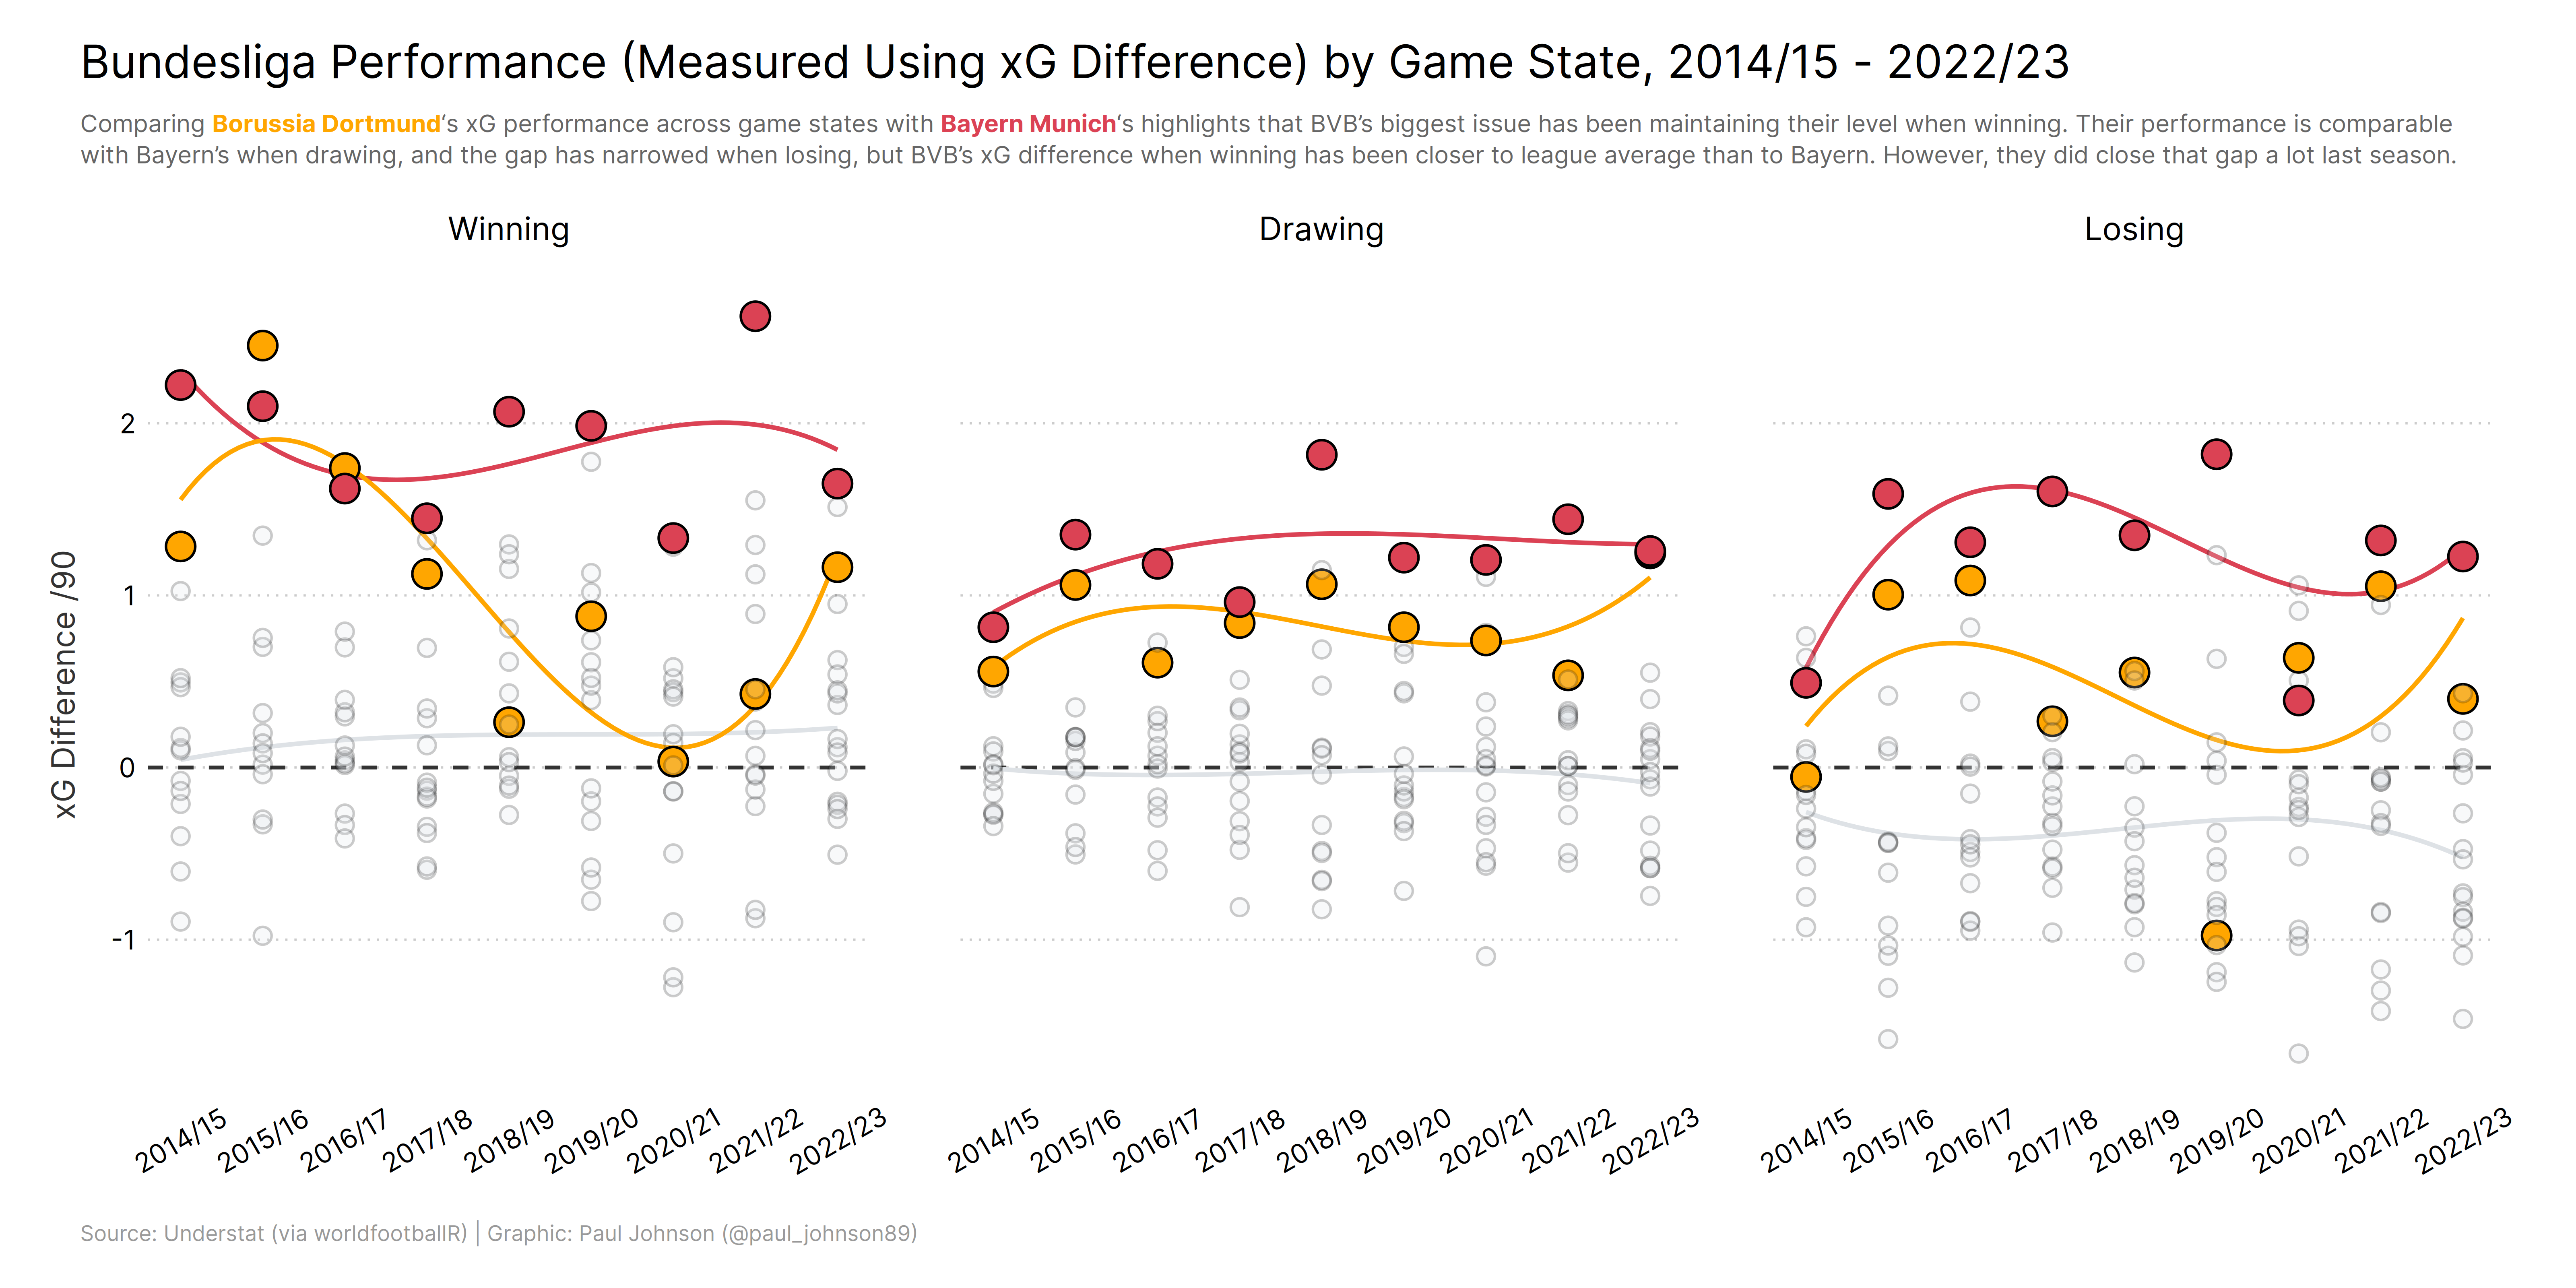


 https://github.com/Paulj1989/football-analytics